The course of the coronavirus pandemic
With two more short lockdowns through the winter?
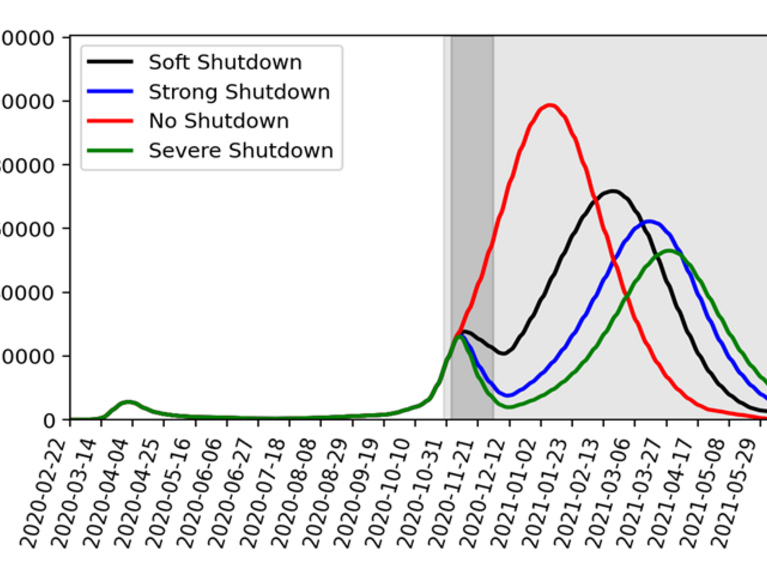
Forschungszentrum Jülich has calculated various scenarios for the further course of the pandemic. The graph shows: without a shutdown in November, the new infections in January would be over 100,000 on a seven-day average (Source: FZ Jülich).
What will happen with the coronavirus pandemic in the coming months? Forschungszentrum Jülich, together with the Frankfurt Institute for Advanced Studies, has calculated various scenarios. In an interview, Jan Fuhrmann explains what the prospects are and what is important.
The physicist and mathematician Jan Fuhrmann from the Jülich Supercomputing Centre (JSC) calculated the simulations together with FIAS. Image: MFO/Petra Lein
Mr. Fuhrmann, you have simulated in various scenarios how the pandemic could develop in the coming months. In the last few days, the number of new infections has fallen slightly. Have we already seen the worst of the current wave?
We cannot yet answer that with certainty. The development of the contact rate will be decisive for the further course of the pandemic this winter.
How exactly is the contact rate defined?
The contact rate indicates how many relevant contacts an individual has in a given period of time, for example in a week. Relevant contacts include encounters between infectious and healthy individuals in which such proximity is established that the virus is transmitted in the process. Because the virus is highly contagious, this can be the simultaneous presence of two people at a distance in a room without a mouth guard. The contact rate is influenced by many factors.
In "Lockdown light", restaurants and bars in Germany, among others, are closed. Image: Helmholtz/Julia Krämer
From the current "Lockdown light" for example.
Exactly, a lockdown causes the contact rate to decrease. The more comprehensive the lockdown, the more the contact rate decreases. The season also plays a role: In winter, people meet more often in closed rooms, where the contact rate is higher. We take all these factors into account and incorporate them into the determination of the contact rate. And then we simulate how much people meet and get infected, to put it simply.

First scenario: 4-week shutdown in November, no further action after that. The graph shows the daily new infections in the 7-day average (Source: FZ Jülich).
According to your simulation, how will the new infections develop over the next few weeks?
We have modeled four different scenarios in our simulations, which we perform using differential equations. In the first scenario, we assume that the four-week shutdown in November will continue and that no further measures will be taken during the rest of the winter. This has an impact on the contact rate, which drops noticeably in November. We distinguish between a soft lockdown, in which the contact rate is reduced to 35 percent compared to the contact rate, and a hard lockdown, where the contact rate drops to 25 percent. Based on current knowledge, the current lockdown is probably slightly below the hard lockdown.
First scenario: 4-week shutdown in November, no further action after that. The chart shows the intensive care bed occupancy (Source: FZ Jülich).
What happens if the lockdown actually ends at the end of November?
From December onwards, the contact rate would increase again. In February, the daily rate of new infections could be well over 50,000 cases if contacts returned to the level of late summer and no new countermeasures were taken in the following months. Furthermore, the number of COVID-19 intensive care patients could rise to more than 20,000 in February and March. This would overload the capacities of intensive care units in many places in Germany - even if the remaining hospital operations were to be reduced to such an extent that the number of intensive care patients not suffering from COVID-19 would be reduced to the bare minimum. Only at the end of May would the situation be expected to return to normal when the effect of the expected better weather becomes noticeable, as was already the case last summer.
How can we prevent the pandemic from continuing at such a high level in the coming months?
In a second scenario, we simulated the course of events if, after the shutdown in November, there were an additional 2-week shutdown in early 2021. This could ensure that the number of new infections per day would not exceed 50,000 and that the number of intensive care beds required would remain below 20,000. In addition, the maximum number of intensive care beds would be reached later, which would allow more time to prepare for this situation. If a further, third lockdown of two weeks were to take place in February - our Scenario 3 - the number of intensive care beds required could possibly even be permanently below 10,000. With two further, shorter lockdowns, we could thus get through the winter to some extent. Alternatively, maintaining contact reductions, as they were already in force in many places before the lockdown, together with better self-isolation of people who think it is quite possible to be infected - for example, due to symptoms or known contacts with infected persons - could prevent a renewed increase in new infections and, as a result, in the number of intensive care patients until spring.
How reliable are these simulations?
We also include different age groups and the corresponding risks in our models, as well as the contact between the age groups themselves. We also take into account subtleties such as the fact that in many households children and parents live together. Nevertheless, we can only indicate the probable development under the appropriate conditions, but in reality things can turn out quite differently. But with each day that the reports of the Robert Koch Institute provide us with data, our calculations become better and better because they are largely based on data from the past. The longer the pandemic lasts, the more reliable our simulations should become. All simulations that go beyond a few weeks can only describe scenarios because they always make very specific assumptions about political decisions and reactions of the population. And finally, a pure look at the case numbers always leaves open the question of the possibly strongly fluctuating number of unreported cases.
The longer the pandemic lasts, the more reliable the simulations become.
Theoretically, one could already now draw up a kind of plan until spring based on such simulations and provide for further short lockdowns?
One could do that, but of course it's not our job to decide that. We can only give the decision-makers and basically also every single interested party something to help them better assess the unclear and very dynamic development. In my opinion, the problem with possible future lockdowns could be that an agreed lockdown only takes effect after a delay. After about a week at the earliest, the number of new infections starts to decline, and before that they increase. In view of the intense public discussion about the necessity of measures such as the lockdown, these measures are only considered when the situation is already worsening. And then there is the additional fact that a few days' lead time is needed to prepare everything. That's why the lockdown will probably come rather late in the future, the situation will worsen in the first days of the lockdown, and then it is to be hoped that the late lockdown will help us get back on track. As things stand at present, this seems to have been achieved in November, although we cannot, of course, say for certain how great the contribution of the lockdown will be to reducing the contact rate. There are some indications in the data that local measures and increased sensitivity in the second half of October have already made a difference.
What if a vaccine were available at the end of this year or early next year?
We could integrate the effect of a vaccine into our simulation in a wonderful way. Anyone from the group of healthy people who is vaccinated would basically switch to the group of convalescents as a result of the vaccination. After all, the vaccination leads to the immunity that is otherwise achieved after an infection. Depending on how many vaccinations are given and with whom, progress could be achieved relatively quickly. The vaccinations could actually become a "game changer" if the optimistic study results regarding the efficacy and safety of the vaccines are confirmed in real life applications.
The physicist and mathematician Jan Fuhrmann from Forschungszentrum Jülich worked closely with epidemiologists and mathematicians in developing the simulations.
Further Informationen
Original publications on model development during the first COVID 19 wave:
Archives of Public Health (Juli 2020)
PLOS ONE (September 2020)
Related articles


Readers comments